(11 am. – promoted by ek hornbeck)
There is nothing in this world that one cannot get more cheaply by using more oil to get it – whether by importing it, mechanizing its production, or using more energy to extract it. This is not only true of industry, but of people as well: Americans moved to the suburbs because it was cheaper to drive farther than to work through the problems of urbanization, and one could get a larger house with a larger yard in the bargain. As long as it was cheaper to pay rent to Saudi Arabia for the oil, because that is what we are doing, than to pay rent to the government for a working city, people chose to pay rent to OPEC rather than taxes to the overnment. This ability of oil to be used in place of almost everything else, and not whether there is “enough” oil, is the special property that makes it the basic scarcity of the world economy.
— Stirling Newberry, American Thermidor
If you haven’t read it, American Thermidor (part 1, part 2, pdf) is well worth your time. Personally, I think maybe Stirling goes too far in suggesting that the enoughness of oil is not its critical feature, but your mileage may vary.
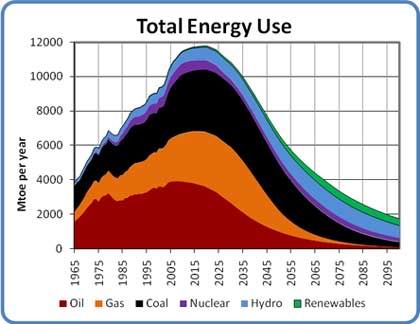
Previously, I showed the linear relationship between global energy use and population growth, suggesting that a population crash is the predictable outcome of the coming decline in energy use following peak oil (year 2011), peak gas (year 2020), and peak coal (year 2030).
As if “We’re all gonna die!” weren’t bad enough, it gets worse:
We’re all gonna die flat-ass broke!
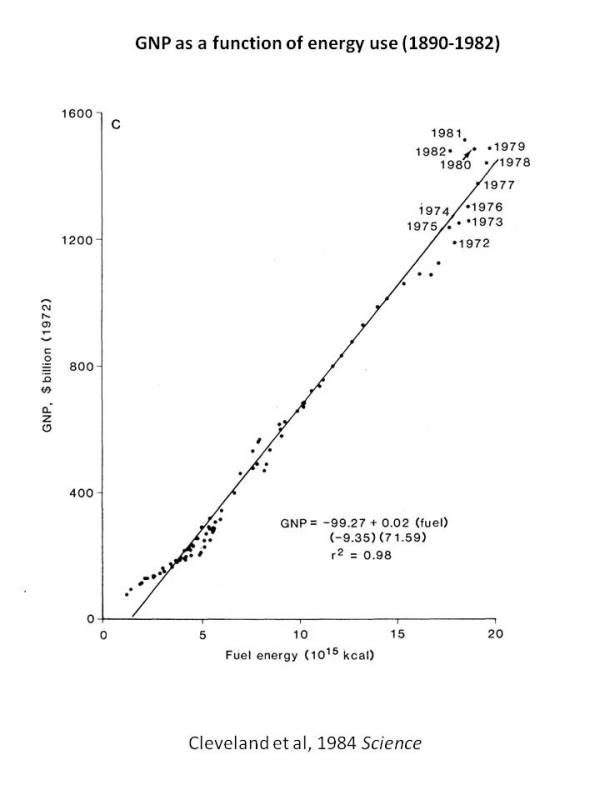
Except for the Cleveland data, all the GDP data below are from World Bank Development Indicators, Internation Financial Statistics of the IMF, whereas all the energy data are from the US Census.
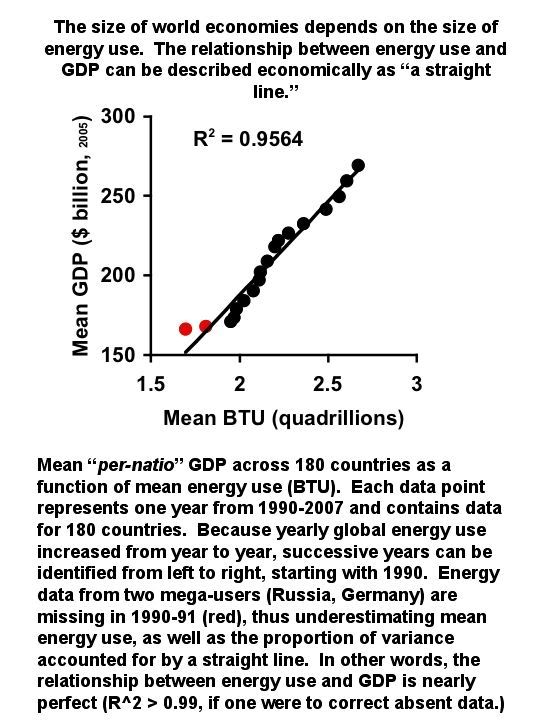
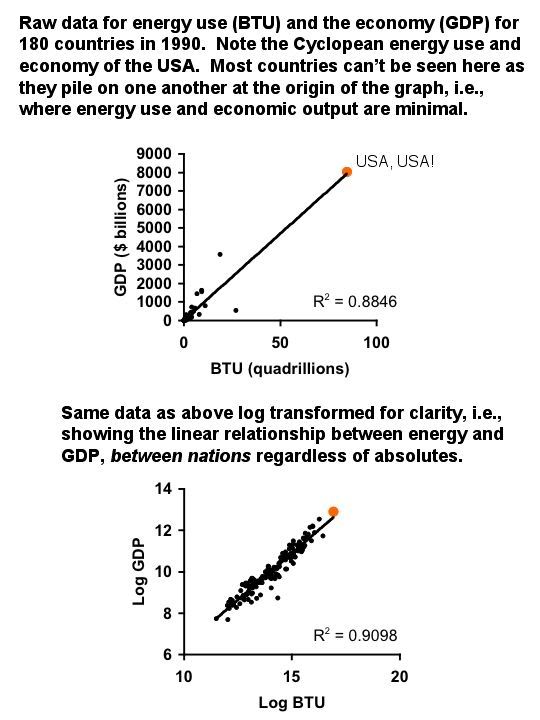
World-wide GDP as a function of energy use expressed in British Thermal Units (BTU)
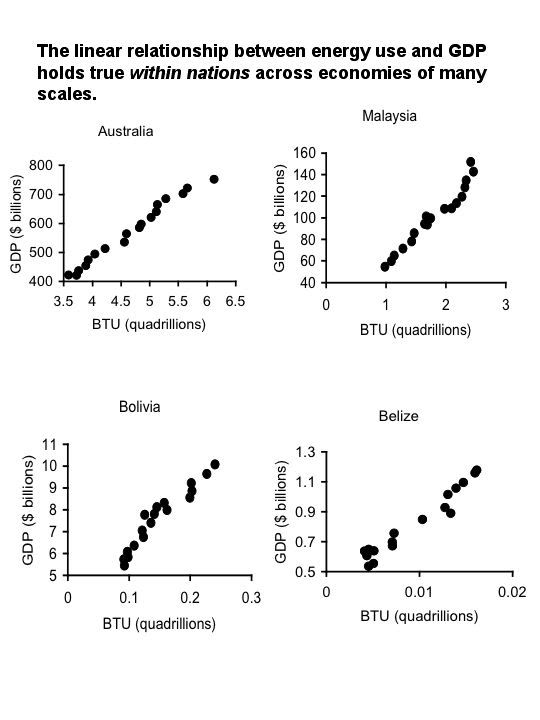
I went through all the data, and just about every single country, except for a handful, e.g., Afghanistan, shows the same linear pattern.
Yes, we are entering a new phase of economic maturity, if by “maturity” you mean “death.”
Here’s the long-term data on the US GDP by energy use from Cutler Cleveland et al, pdf:
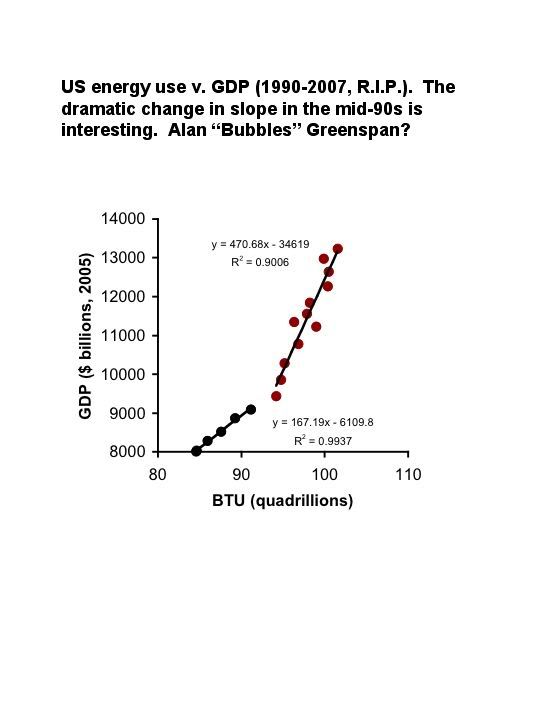
And here’s the US data from 1990-2007:
I find the sudden increase in the slope of the line between energy use and GDP oddly interesting. Did we suddenly get more bang from our petrol, or did Greenspan’s financial engineering have some outsized effect on GDP (as Stirling suggested policy makers were necessarily doing in our “paper for oil” scheme)?
Anyway, I hope it’s clear which way the world’s economies are going when fossil fuel use necessarily goes south.

2 comments
Author