(8 am. – promoted by ek hornbeck)
For anyone whose read my pieces in the past, knows that I hold a certain disdain towards former Reagan White House OMB Associate Director/conservative-libertarian Ayn Rand acolyte Larry Kudlow. It’s nothing personal against the guy, it’s his ideas and economic policy objectives that I find fault with. For the past couple of months, he’s been going on about this is the “Goldilocks economy.” Essentially, that we’re worrying about nothing because one bad economic indicator is being offset by a good one (mind you, he’s often just used productivity as that one). Well today, despite his claims that all is almost well, we got some news that just proves Larry Kudlow wrong!
Ok, I will give him some credit. He isn’t a Pollyanna and he has come out and said this or that has been bad or needs to get better. Still, his overall anthem is that things are really great and that we (he’s quoted Phil Graham) should stop “whining.”
Inflation is still there and going higher.
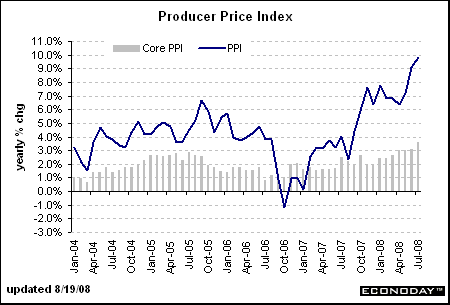
Just before the market opened, the Producer Price Index (PPI) figures were released. For the uninitiated, the PPI could be considered the rate of inflation faced by companies producing goods for the consumer; it’s sister number, the Consumer Price Index (CPI) is the inflation number we face. Like the month before it, the PPI numbers representing July were still going like gangbusters, with the official rate now at 3.1%! Now, keep in mind, that this was also the period coming off high oil prices; in early July we saw that infamous $145 per barrel being traded on the New York Mercantile Exchange. Also, the grain complex was at it’s latest seasonal peak at that time. So there’s going to be some commodities bull related bias.
Experts were hoping between a .5% increase from the previous month, but instead we had a 1.5% increase! Minus energy and food, the range was .1 to .3% growth, which turned out to be way under as .7% growth was reported. Once again, keep in mind the previously mentioned bias.

Commodity prices have since come down, as noted in yesterday’s Manufacturing Monday. August may well show a lower PPI number, and a possible contraction instead of growth. Still, it would pay to keep on guard, as CPI numbers could very well tell if consumers are gaining any benefit from the fall in ag’ prices. But it goes to show, that Kudlow has been wrong this past Summer. Now CNBC will not have his summer Pollyanna fest up there (gee I wonder why), but I’m sure on YouTube there are some. Anyways, despite these conservative’s claims, inflation is still with us.
Unfortunately, these are the government’s “official numbers,” which we all know are garbage. The rate of growth in PPI from last year, is officially 9.8%, but from what I’ve read if using even the formula by the first Bush Administration, we’re talking about 11%, and if using the one going back to before Reagan then it’s more like 15% growth rate. Either way, inflation is way more than what is being reported. Now these are growth rates of the inflation index itself, not the inflation rate that producers are facing. Kinda confusing, I know, but there is a difference. As mentioned, inflation faced by producers (using the latest government formula) is 3.1%, and that number is growing year over year by 9.8%. So if Larry Kudlow, or Rush Limbaugh or any other conservative commentator tells you things are great, well now you got empirical proof that they’re full of it; though I suppose we all already knew that, didn’t we?
Still raining on the home front
It may be sunny and nice outside, but in the real estate market things are still looking like a wet gray day. Couple of numbers released today that reflect the current conditions in housing. Once more, last month Larry Kudlow (and several radio talk show hosts) were saying that things were looking up because the home sales were picking up. Ok, I’ll buy that, but was it bargain hunting and what about foreclosure rates?
One good barometer to see how housing is doing is to check up on companies that profit from either home construction or fixing up where one lives. Today Home Depot reported a 24% drop in income for the second quarter. The street was already bearish on the company, so bearish that the numbers they reported actually beat estimates! Even so, beating estimates isn’t exactly hard when everyone thinks you’re dying. But if one thinks that Home Depot’s numbers are an abberation and that thinks are still swell, one need only look at the latest from their competitor, Lowes which itself reported a horrid statement.
Lowe’s, the US home improvement retailer, on Monday highlighted the acute regional differences in the housing-based economic slowdown, as it reported an eighth consecutive quarter of falling comparable sales.
Bob Niblock, chief executive, said the comparable sales at its more than 1,500 stores still closely tracked the extent to which their local markets had experienced steep falls in house prices.
“Generally, our weakest comparable sales tend to be in areas that have experienced the greatest declines. Where home prices have been or have become more stable, our ‘comps’ have been much better,” he said.
Lowe’s stores in California, Florida, the Gulf Coast and the north-east – which all saw acute falls in house prices – saw double-digit declines in comparable sales during the quarter.
– excerpt from “Lowe’s results reflect US housing woes“, Financial Times, 2008.
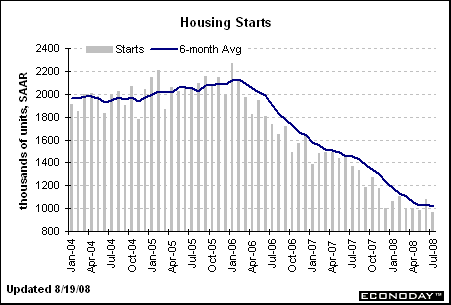
This comes to no surprise as the latest housing starts numbers, released today, show that the industry is in a downward ski slope! There is still a massive amount of supply of homes out there. Reports abound of 21st century ghost towns, where builders are holding the bag on a bunch of homes, giving up on the upkeep on their developments.

Housing starts, which is the figure reporting new home construction, were reported at .965m for July, which unless my math is wrong means 965 thousand new homes (if I’m wrong here, please correct me). Industry watchers were looking between .890M to 1.0M homes. This is still below June’s number of 1.091M homes. Still, that’s a lot of houses on the market! All this of course is still having an impact on financial companies. the credit crunch is keeping consumers from blowing more money on their homes, and let’s not forget the two mortgage titans!
Fannie…Freddie…and their cousin Lehman still are lost on the road.
The descent into hell continues for America’s to government-backed financial companies, Fannie Mae and Freddie Mac. Word that the two “giants” were going to issue a large block of new shares to raise capital sent the shares sliding. In a single day, the two fell on average of 5%! Shareholders worried that as the company issued more shares, that whatever earnings they did report would be spaced out into even smaller chunks. Wall Street hates smaller chunks, ladies and gentlemen.
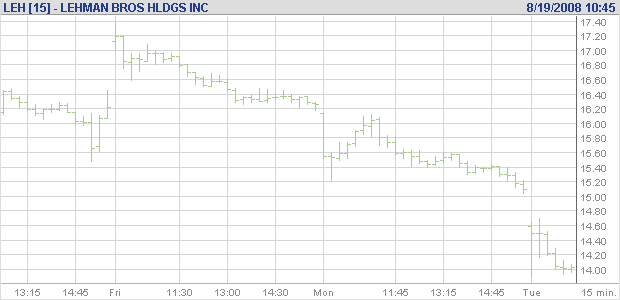
Meanwhile, the rummage sale that was Lehman Brothers continues on in a more sorry state. The company reported another rancid quarter, and talks abound of a possible sale of one of its units. One report from the Wall Street journal says yay on this, while Reuters is reporting that nothing is happening. Either way, for the company to survive, they need to raise capital, the bears shorting the stock believe they will continue to have a hard time to do so. Mimicking Fannie and Freddie, Lehman also dropped about 5%.

A certain retailer is off Target on their earnings, a sign about consumers?
I’m not sure if this is indicative on the state of consumers or not. By me, the local Target is situated across the street from the local Wal-mart, both catering to the same clientele. Now the infamous Arkansas giant on Thursday reported a 17% increase in business while Target (pronounced by many here as “Tarjay”) is today reporting a huge drop. I walk into Wal-Mart once or twice (I’m sorry, I just hate the company) and they have less cars parked in front than the Target and the store looks like a dump. Target’s always full of customers and I’ve noticed that many times their prices are cheaper and the damn store’s cleaner! Perhaps this isn’t the case by you, and yes, I also am skeptical about the food counter at “Tarjay” as well.
Target Corp. (TGT), the second-largest discount retailer in the U.S., reported a decline in second-quarter profit as consumers cut back on discretionary spending and delinquencies increased on credit card payments during the ongoing economic downturn.
This is the fourth consecutive quarter of lower profits for the Minneapolis, Minnesota-based retailer. The challenging economic environment, precipitated by the subprime crisis, credit crunch, as well as high food and gasoline prices, has meant that consumers are being more prudent about what they spend their money on. More profitable items such as home goods, clothing and jewellery, which make up about majority of Target’s sales, have gone way down in the consumers’ priority list.
– excerpt from “Target Q2 profit drops 7.6% as consumer spending, weak credit card operations weigh on results“, RTTN News, 2008.
As the article suggested, consumers had cut back due to increased costs in fuel and other things. That inflation ate into those so-called stimulus checks. Retailers were hoping that that financial government cheese was going to go into their pockets, but it seems more as if instead of Target’s it went to Citgo or BP’s accounts. Another critical thing is the continued problems with credit. Delinquencies are on the rise and the banks are getting more tight with whom they dish out credit too. Indeed, one could even see a raise in rates!
Why you could be seeing an increase in your credit card’s interest rate.

Please take a moment to take a look at the chart above. It is a graph of the LIBOR September futures contract traded on the Chicago Mercantile Exchange. So what is LIBOR? LIBOR stands for the London Interbank Offer Rate, which is the interest rate charged between banks for loans, often unsecured ones. LIBOR is a benchmark rate, meaning its base to work off of, you’ve seen this quoted on from credit card interest rates to what you may pay on a home loan of some sort. Often, a bank will charge LIBOR plus several points. Now there are many sites that offer what the current rate is, and it helps to know if it has gone up or down, if one owes money on say a credit card. Another particular useful (well to me at least) piece of info are the futures on the interest rate. Often the futures will peg where your interest rate a couple months down the road will be.
As mentioned, the above chart shows the latest, and to best read it, simply take the current figure (in the blue box) and subtract that from 100. So in this case, we get 2.54, that is telling us that folks expect LIBOR to be 2.54% in September. So why should we care about that? Because recent we had a big drop in the LIBOR future from 97.54(or expected interest rate of 2.46%) to the current number. This coincides with a story in the Financial Times. Looking at the chart, many fear that we could see a break below the lows of July of 97.34 (or 2.66%) or even the contract low of last September of 94.50 (5.5%)!
The key rate at which banks lend to each other in dollars hit its highest level in two months yesterday, suggesting there could be more turbulence ahead for the financial system.
The three-month dollar London interbank offered rate reached 2.81 per cent, a level not seen since mid-June. Libor remains particularly elevated when compared with the official overnight rate – the Federal funds rate – of 2 per cent. The difference of 81 basis points between Libor and the Fed funds rate compares with an average spread of about 12bp that prevailed before the onset of the credit squeeze last year.
“There is still stress in the system,” said George Goncalves at Morgan Stanley. “Libor is creeping up and banks are still re-structuring their balance sheets.”
– excerpt from “Libor rise sparks bank fears“, Financial Times, 2008.
So why give a damn about this obscure figure not really reported by the mainstream press? Because banks are super sensetive to this number. A small jump will cause them to raise interest rates on loans across the board. Look at your upcoming credit card statements, and also ones in the past, look when they’ve gone up, often around or after a LIBOR jump. Secondly, as the FT article noted, financial companies are still at the breaking point. This is the rate many of these firms use to finance their trades (go back to the Lehman bit). They, like the rest of us, simply cannot afford any increase in these rates. Should we go back to or north of 5% on this, expect to see more failures in the financial sector.
Cross posted on
The Economic Populist –
A Community Site for Economics Freaks and Geeks

1 comments
Clinton destroyed MI, and Bush destroyed the world.