
(9 am. – promoted by ek hornbeck)
This is the follow-up to News You Won’t Read in the Newspapers: Unemployment breaks 10%.
Yes, that’s right. 0.3% higher than the broad-unemployment peak two years after the 2001 recession kicked off. What you will read in the papers, though, is that “the” unemployment rate hit a five year high. That’s what you’ll see in the headlines … the headline unemployment rate.
The fact that broad unemployment seems to be at its highest point since they started calculating it this way in the mid-90’s? {*chirp*} {*chirp*} {*chirp*}
Series Id: LNS13327709 | |||||||||||||
| Year | Jan | Feb | Mar | Apr | May | Jun | Jul | Aug | Sep | Oct | Nov | Dec | Annual |
|---|---|---|---|---|---|---|---|---|---|---|---|---|---|
| 1998 | 8.4 | 8.4 | 8.4 | 7.9 | 7.9 | 8.0 | 8.1 | 7.9 | 7.9 | 7.8 | 7.6 | 7.6 | |
| 1999 | 7.7 | 7.7 | 7.6 | 7.6 | 7.4 | 7.5 | 7.5 | 7.3 | 7.4 | 7.2 | 7.1 | 7.1 | |
| 2000 | 7.1 | 7.2 | 7.1 | 6.9 | 7.1 | 7.0 | 7.0 | 7.1 | 7.0 | 6.8 | 7.1 | 6.9 | |
| 2001 | 7.3 | 7.4 | 7.3 | 7.4 | 7.5 | 7.9 | 7.8 | 8.1 | 8.7 | 9.3 | 9.4 | 9.6 | |
| 2002 | 9.5 | 9.5 | 9.4 | 9.7 | 9.5 | 9.5 | 9.6 | 9.6 | 9.6 | 9.6 | 9.7 | 9.8 | |
| 2003 | 10.0 | 10.2 | 10.0 | 10.2 | 10.1 | 10.3 | 10.3 | 10.1 | 10.4 | 10.2 | 10.0 | 9.8 | |
| 2004 | 9.9 | 9.7 | 10.0 | 9.6 | 9.6 | 9.5 | 9.5 | 9.4 | 9.4 | 9.7 | 9.4 | 9.3 | |
| 2005 | 9.3 | 9.3 | 9.2 | 9.0 | 8.9 | 9.0 | 8.8 | 8.8 | 9.0 | 8.7 | 8.7 | 8.6 | |
| 2006 | 8.4 | 8.4 | 8.2 | 8.1 | 8.2 | 8.4 | 8.5 | 8.4 | 8.0 | 8.2 | 8.0 | 7.9 | |
| 2007 | 8.3 | 8.1 | 8.0 | 8.2 | 8.3 | 8.3 | 8.3 | 8.4 | 8.4 | 8.4 | 8.4 | 8.8 | |
| 2008 | 9.0 | 8.9 | 9.1 | 9.2 | 9.7 | 9.9 | 10.3 | 10.7 | |||||
 OK, what about the raw figures, without seasonal correction?
Well, nope, the raw figure in June ’08 was 10.8, the raw August figure is 10.7.
In other words, August is neutral with respect to the seasonal unemployment correction, so its the same 10.7% either way.
And the economic news was already bad, with stock market speculators waiting on today’s job figures:
…
Wall Street was hammered overnight as more losses in private-sector employment weighed on market sentiment and fears that consumption, a main pillar for US growth, is stumbling.
…
Markets were awaiting further US jobs data due Friday amid expectations that more bad news was on the way.
Well, those fears were realized today … and that’s just the headline rate of 6.1%, “merely” a five year high. The broad rate is even worse.
But you likely won’t read about it in the papers.
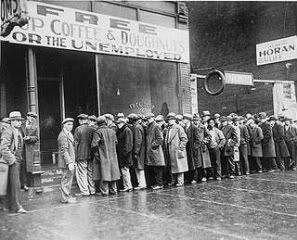
Like they knew in ’32 …
… sometimes you need an upbeat song to go with bad news.
16 comments
Skip to comment form
Author
… temporarily on Agent Orange about adding “section” views will be put back up, slightly expanded, tomorrow at noon, Eastern DST.
Good thing that (according to “them”) inflation is under control!
but am assuming that you’re including all those pesky #s the GOPers usually omit, like long-term unemployed and underemployed-looking-for-a-fulltime-job?
And now we have to eat Fannie Mae and Freddie Mac. Loverly.
i see these numbers steadily dropping in the clinton years… & then ONE MONTH after taking office the numbers rise…& rise…& rise…& rise….
& i’m pretty sure these don’t take into account those who did NOT get unemployment when they lost their jobs or those whose unemployment ran out before they found a job…. but i may well be mistaken.
hey BruceMcF I moved your excellent table below the fold. It was too wide for our front page.
calculates various economic things. They say when you add in the “defined away” unemployed–those who’ve given up on work–the rate is actually:
about 15%. I read somewhere, and could never find the link again, that if we counted by the same standards as the Great Depression, the rate would be not far off that era’s 20-25%.
But shadowstats.com has some interesting charts on the money supply, GDP, etc, as well. And I imagine someone who knows where to look could verify or debunk that 15% figure.