(10 am. – promoted by ek hornbeck)
An interesting piece by Rebecca Wilder I saw at the Angry Bear economy blog really jumped out at me. The nutshell is this:
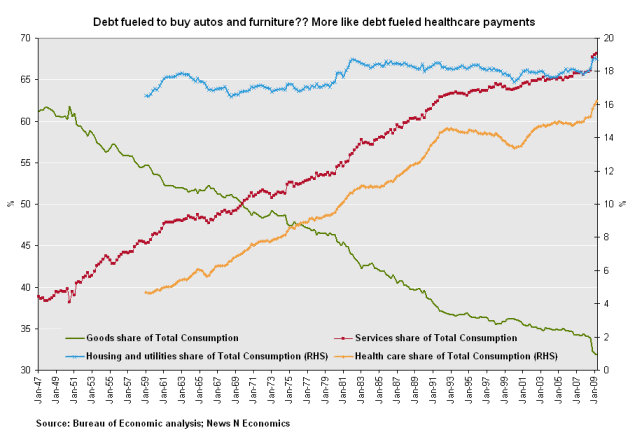
The goods share of total consumption has been falling quite dramatically, while the service component surged. Therefore, it is more likely that the debt fueled consumption was going predominantly into the service component (paying service bills).
In Q2 2009, 25% of service spending went to health care – outpatient services (physician, drugs, dentist) or hospital and nursing home services – and 29% of service spending went to housing and utilities – rent, water, electricity, and trash. As such, over 50% of service consumption is more likely to remain stable, even rise faster, with the Boomers out there.
The chart is here:

Sorry about the left and right vertical axes… to get it to post, I had to shrink it. Full blown chart is here.
Note that consumption of goods has dropped from just over 60% to just over 30% in the past 60 years, while spending on services has steadily increased from just under 40% to nearly 70%. The two dataplots connected to the right hand axis, rent/housing and healthcare, show that health care has tripled as a fraction of spending during that period while housing costs have edged up slightly as a fraction of spending.
How does this tie in to debt? Well, you probably already know the answer to that one, but allow me to belabor the point.
First, can we all agree that over-borrowing to support excessive consumer spending was a major contributor to our economic collapse? If you can’t agree with that principle, you probably need to be reading some other blog where everyone loves to discuss 0% card balance transfers and credit scores.
There is a not-too-bad article up at the Wall Street Journal on how consumers have hunkered down and are unlikely to resume their freespending ways any time soon. Even though it has useful on the ground observations about the new consumer austerity, it repeats the oft-repeated tidbit that consumer spending is 70% of the economy.
Make that “was”. 70% (depending on the metric used, it could be 71% or 72%) was not sustainable. Some of the cutback is due to worries about the economy. Even though the article does mention that consumers are starting on what may be “a prolonged period of thrift” no where does the article acknowledge that the consumption level was unsustainable and debt fueled.
The economy-wide delusion about the long-term trend of housing prices seems to have been both a cause and effect of the bubble, as well as a cause of highly unrealistic individual/household estimates of wealth that could safely be borrowed against now. So, yeah, lots of people who wrongly thought they were house-rich ran up their credit cards. I think it’s safe to say that there was “too much” debt-financed consumption.
What a buncha hooey. In the presence of the data from Angry Bear contributor Rebecca Wilder, it ain’t the Hummers, iPods, and Wiis: it’s the services, stupid. To my mind, if there is a lesson in this story, it surely is that health care reform is required in order to save the economy for us “main streeters.” Said the president:
The only way this century will be another American century is if we confront at last the price of our dependence on oil and the high cost of health care, the schools that aren’t preparing our children and the mountain of debt they stand to inherit. That is our responsibility.
Please. Call your congresscitters!

8 comments
Skip to comment form
Author
Wonder if Anthem/Blue Cross will take mojo in place of dollars? heh.
No apologies — it’s easy to read. The point is well taken, too. Thanks.
thanks
♥~
I first got slaughtered on my credit cards back when I had a tooth break, then another old filling broke. I had to get two root canals, then caps, with no insurance.
That’s a ton of money. And it’s not like I had a choice in the matter.
I mean, that’s just one tiny example of this.