
(10 am. – promoted by ek hornbeck)
If you only listen to the talking heads you may find it surprising that the housing correction is still ongoing. Quite simply put, with all the efforts of the US government, the Federal Reserve, and various agencies the best they have accomplished is to delay the decline. Now that all the capital is spent, all the programs finished, the decline ensues. The only thing left in the bag is MOPE (Management of Perspective Economics).
What is MOPE? In a nutshell its a pathetic attempt to ‘talk’ people into an action. The theory goes that if you say its sunny outside, and its a torrential downpour, yet everyone leaves the house without an umbrella then the concept works.
For housing the concept is the same. Is everyone telling you that its sunny and “now is a great time to buy” and the justification they use is “look how much prices have come down” as evidence? The first thing I always ask these people is “Can you tell me when when would be a bad time to buy?”. In hindsight they will all mention a few years ago … but when the mania was at hand they were the very same touting the “housing never goes down in price” mantra.
What is left is wishful thinking and its pretty pathetic.
D.R. Horton’s Donald Horton:
“Market conditions in the homebuilding industry are still challenging, with high foreclosures, significant existing home inventory, high unemployment, tight mortgage lending standards and weak consumer confidence. However, housing affordability remains near record highs, interest rates are favorable and new home inventory is still very low,” Horton said. “We continue to focus on providing affordable homes for the first-time buyer while having product available for move-up buyers, further adjusting our cost structure relative to our current sales pace.”
Translation: We’re still in the dumps, but we’re lowering prices, so come on and buy.
Pulte’s Richard Dugas: “Over the near term, we expect the industry will continue to face low levels of demand and that overall operating conditions will remain highly competitive.” Dugas then said he expects a return to profitability in the “back half of the year.”
Translation: Still bad, but it has to get better, right?
Meritage‘s Steven Hilton:
“The market has obviously softened since the federal home buyer tax credit expired in April last year, as reflected in total U.S. home sales as well as our own sales and closings. As a result, we have offered larger incentives in some of our communities, resulting in lower margins that offset the improvements we are achieving in our new higher-margin communities…the spring selling season for the last few months is off to a tepid start, and we have not produced sales at the pace we would have hoped this far into the 2011 selling season. We believe the housing market in general is still bouncing along the bottom, with pockets of strength in certain of our markets.”
Translation: We’re lowering prices, throwing in upgrades, and it’s not really working.
News that serious delinquencies are on the decline suggesting that those left standing in their homes will remain. Kyle Lundstedt of LPS Applied Analytics aka Dr. Doom reports that mortgage delinquencies, down more than 11 percent month-over month, are at the lowest level since 2008.
Emphasizing that subprimes, Alt-A’s, the bad lending of the housing boom, have largely moved through the system already, not to mention that big banks and servicers are getting far more aggressive with loan modifications.
If anything this statement is more MOPE. Taken together I would agree. However Alt-A loans were not confined to just subprime lending. Many Alt-A loans were also prime which is where we find ourselves today with prime resets and recasts.
Dr. Doom finishes by stating “It’s progress; it’s not game-changing.”

The foreclosure pipeline, that is loans 90+ days delinquent or in the foreclosure process, is enormous. Foreclosure inventory is at a new all-time high. There are so many loans still waiting to go into foreclosure…in fact the total number of loans 90+ delinquent is 45 times the size of the current monthly foreclosure sale number.
At the current REO sales rate it would take 48 months to clear the backlog. And this is just inventory in the pipeline, not counting the current shadow inventory or selling the delinquent inventory into the market. All that foreclosure inventory, for that long period of time, will weigh on prices no question.
And what about those aggressive writedowns Dr Doom mentions. Well according to the new MBA president David H. Stevens, who previously helmed the FHA for just a couple years before resigning to join the MBA, (at a hefty increase in salary I’m sure) noted that there are “only so many refis.”
Per the MBA forecast, the refinance share will drop to 26 percent in 2012, down from 37 percent this year and 66 percent in 2010. What seems to be remaining is the backlog of foreclosure inventory as the cure rate for many of these delinquent loans will diminish considerably.
I should include the caveat that all housing is local. Meaning what RE is doing in the flyover states may not be reflected in previous bubble states.
With various Federal and State programs now complete, and a new austerity environment in Washington home prices are now resuming the trend that started in 2008. Two years and hundreds of billions of dollars later the efforts have been a massive transfer of wealth to the banking service sector, a brief two year delay in stabilizing prices with home prices now below their 2009 lows.
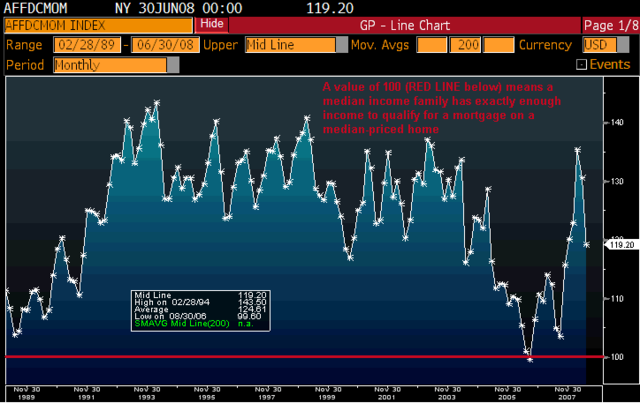
With real incomes having been stagnant for over a decade it is pure MOPE that housing affordability is at a generational high. Aside from the sources that push this mantra, touting declining prices and low interest the fact remains its income that qualifies a borrower. On that score, there’s little reason to expect much of a bounce.
Clear Capital today released its monthly Home Data Index™ (HDI) Market Report, and reports prices have double dipped nationally 0.7 percent below prior lows experienced in March 2009.
Report highlights include:
- National quarterly home prices changed
4.9%; while yearover-year national price changes reached -5.0%.
- National home prices have fallen 11.5% over the previous nine-month period, a rate of decline not experienced since 2008.
- In a sign of the continued volatility and fragility of home prices, all the major Metropolitan Statistical Areas (MSA) tracked in this month’s report showed quarter-over-quarter price declines.
- National REO saturation rate reaches 34.5%.
However there still is massive government support in the RE market. Historically government market share has been 20%-30% which icludes FNM, FRM, FHA and a host of others. Those that decry “socialism in America” and point to healthcare as evidence miss the mark. Look no further than housing where you will find over 90% government loans supporting the RE market. This situation was put on steroids as part of the banking bailout by accepting all the garbage WS cranked out and taking onto the public dole.
Just take a look at FHA’s books (historically 10% of the normal government share of the market)
According to this report, the pace of FHA property sales began to slow significantly last November, was virtually at a crawl in December and January, and remained shockingly low given the inventory levels in February. As a result, the reported inventory of FHA REO has exploded upward to 68,801 at the end of February from 54,609 at the end of October and 44,605 at the end of last February.
So where do we go from here?
Without government incentives and a panacea of easy credit we are witnessing first hand the delayed inevitable fall.
Michael Fratantoni, vice president of research and economics for the Mortgage Bankers Association.
Fratantoni said a phenomenon is now surfacing in housing that is essentially a “tale of two cities” where home prices are beginning to stabilize in economically viable parts of the country, while other areas are paralyzed by high unemployment and large shadow inventories.
Meanwhile, the shadow inventory that is driving down prices in parts of the U.S. is stalling an overall national recovery even though most of the distressed inventory is concentrated in Florida, California, Illinois, New York and New Jersey.
What the market seems to be telling us is that prices in these affected areas will continue their decent. Tight lending standards requiring the traditional 3x income and a LTV of 80% are returning as the historic norm. As previously stated incomes have stagnated for over a decade and banks risk aversion returning have taken any recovery out of the market.
A 20% down on a $400K house requires an $80,000 down payment. With so many homeowners with little or no equity … or more likely underwater … how will a future homeowner be able to save this amount? It has long been accepted that one should go to college to get a good job, buy a house, start a family …. etc. People graduating from college today are now weighed down with a mortgage before they even own a home. Where are these new buyers suppose to come from?
So while we have the NAR touting that we have the Cheapest Homes in 40 Years and yet they cannot figure out why buyers are not returning in droves. They site all the usual droning as evidence.
Falling prices have made real estate the best buy in at least four decades. Housing affordability reached a record in December, according to National Association of Realtors data that go back to 1970. The group bases its gauge on property prices, mortgage rates and the median U.S. income.
Are homes really the cheapest they have been or is this an industry with a lot of skin in the game? And how has their accuracy been over that span?
The WSJ finally concedes that NAR has been fixing its data for year and has understated the extent of the crash.
The group reported that there were 4.9 million sales of previously owned homes in 2010, down 5.7% from 5.2 million in 2009. But CoreLogic, a real-estate analytics firm based in Santa Ana, Calif., counted just 3.3 million homes sales last year, a drop of 10.8% from 3.7 million in 2009. CoreLogic says NAR could have overstated home sales by as much as 20%.
And what about that affordability measure? According to NAR during the entire housing boom from 1996-2007 there was only one single month where housing was unaffordable. How is it that a multi-generational boom in housing only muster a single month of affordability? What kind of metrics are being used to state housing is ALWAYS affordable? That metric shows that homes are way off of their boom highs, but still remain somewhat overvalued relative to the buyers ability to pay for that home. If you were to measure affordability BUT ignore that metric (of ability to pay), what you will end up with is lots of new homeowners who cannot afford to pay for those homes. Which in turn leads to lots of foreclosures – which is exactly what has occurred here.
So what should home prices be?
I would argue the measure of Median income to Median home price a much better gauge. It tracks people’s ability to pay for homes – an important data point if you want to see a measure of affordability that also imagines not being foreclosed upon is a relevant part of affordability.

From the mid/late 1970s to 2001/2002 the ratio was consistent in a tight range between 2.6x to 3.0x. Essentially this means the median home price in this country was 2.6x – 3.0x median household income. And it’s been right around 2.8x for most of that time. That’s 30 years….
9 comments
Skip to comment form
Author
Author
to offer a little feedback. :o)
The spell may be broken or at least the spell has begun to break up. That spell is the notion that “owning” property is a good thing. In fact, in my view, it generally is not a good idea at least at this time (unless its ocean-front). This fetish with “buying” property was a clear effort on the part of gov’t and industry to privatize the culture–“a man’s home is his castle” of course it isn’t true. This decreases class-consciousness so that working class people (I include here much of the so-called middle-class as well) are steered away from solidarity and closer social interaction and interdependence. We have our separate private life based in our home where we can cocoon ourselves and only interact with others strictly on our own terms. This idea of private life being the center of this culture has, in my view, outlived its usefulness from a developmental POV. The owner-occupied suburban house represents a way of life that is unsustainable in the long-term and will, thankfully die-out or be seriously altered.
People are beginning to realize that housing prices don’t automatically grow and that being stuck underwater is a serious risk that can be a personal disaster because it means that if you want to move to find work you can’t because you can’t sell your house–my daughter and her husband are in this situation. Your geographical area could, at any time, lose industry or your locality might not be able to afford to provide good schools or services and therefore be unattractive to buyers. There are a few areas that may have a guaranteed housing market but even those aren’t going to experience the kind of growth we’ve seen in the past.
Therefore, the housing market is, I believe, going to remain stagnant for some time to come due to what I just mentioned and all that you mentioned. Most people should not buy houses at this time. Good diary.
About the retiring baby boomers and the 30 somethings with two degrees but working at Best Buy and the dream of home ownership becomes maybe a high density condo complex. No jobs no McMansions in suburbia. I also think housing stats are much like the meaninglessness of computer processing power “improvements” when such things are geared more towards enslaving/exploiting people than advancing the cause of mankind.