
May 2011 archive
May 01 2011
Cartnoon
May 01 2011
The Internationale
| Arise ye workers from your slumbers Arise ye prisoners of want For reason in revolt now thunders And at last ends the age of cant. Away with all your superstitions Servile masses arise, arise We’ll change henceforth the old tradition And spurn the dust to win the prize. So comrades, come rally No more deluded by reaction So comrades, come rally No saviour from on high delivers So comrades, come rally |

May 01 2011
Bamyan Heart of All Hazaras
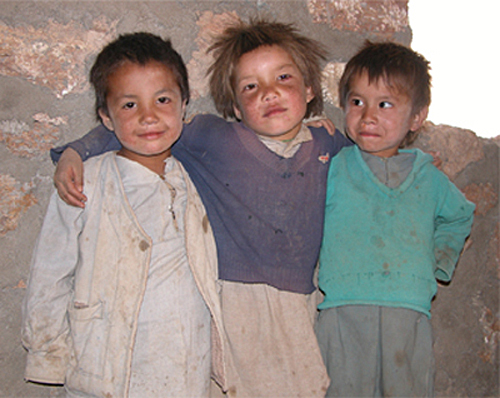
Asia heart of world,Afghanistan heart of Asia,Hazarajat heart of Afghanistan,Bamyan Heart of All Hazaras in world,these boys are belongs to Bamyan.look at there friendship they don’t think about bout there Poverty.they need your help.
Photo and caption by Jamail Haider.
May 01 2011
92% of Americans prefer Swedish distribution of wealth.
The mal-distribution of wealth in the United States is at all time highs. A 2005 study conducted before the largest financial theft in history showed that (1) Americans overwhelmingly prefer a fairer distribution of wealth, and (2) they don’t know how badly wealth is currently distributed. Here’s the pdf.
The study’s 5,522 participants were randomly selected from a panel of one million people, and were representative of adult Americans in terms of sex ratio, incomes, political leanings (Bush vs. Kerry voters), and geography. Each participant was given the same definition of wealth:
“Wealth, also known as net worth, is defined as the total value of everything someone owns minus any debt that he or she owes. A person’s net worth includes his or her bank account savings plus the value of other things such as property, stocks, bonds, art, collections, etc., minus the value of things like loans and mortgages.”
Participants were then given a preference test using unlabeled pie charts showing different distributions of wealth across five quintiles.
Americans Prefer Sweden For the first task, we created three unlabeled pie charts of wealth distributions, one of which depicted a perfectly equal distribution of wealth. Unbeknownst to respondents, a second distribution reflected the wealth distribution in the United States; in order to create a distribution with a level of inequality that clearly fell in between these two charts, we constructed a third pie chart from the income distribution of Sweden (Figure 1).2 We presented respondents with the three pair-wise combinations of these pie charts (in random order) and asked them to choose which nation they would rather join given a “Rawls constraint” for determining a just society (Rawls, 1971):
“In considering this question, imagine that if you joined this nation, you would be randomly assigned to a place in the distribution, so you could end up anywhere in this distribution, from the very richest to the very poorest.”
Here are the results of the pair-wise preference tests (with labels now added to the graphs):
May 01 2011
The Week in Editorial Cartoons – So, Who’s the Hair Apparent Now? (Special Appeal)
Crossposted at Daily Kos and The Stars Hollow Gazette
|

:: ::
Note: Sections 1-4 contain dozens of additional editorial cartoons and commentary. I’m not sure why but I was getting the below error when trying to post the complete diary. Check out the remaining portions of the diary at Daily Kos.
java.sql.SQLException: Incorrect string value: ‘xC2x8CxC2xA9=1…’ for column ‘extendedText’ at row 1